The construction of a greenfield underground fiber-to-the-home network includes trenching works and the installation of ducts, cables, cabinets, splitters, splice closures. They all have a cost. But the main cost driver is trenching, which can amount to 50% or more of the total costs. It also is a predictor for equipment costs, like duct and fiber length.
As such knowing the total trenching distance is paramount to estimate the total network costs. You can use several techniques to estimate this distance.
A quick technique is to look at the trenching distance of previous deployed areas similar to your target area. By composing a formula based on similar factors like area size, population density and road lengths, you can derive trenching amounts through extrapolation. As you can imagine, this method has several downsides.
- This technique is useless for firms new to FTTH design, as to finetune such a calculation requires thorough experience.
- To stay accurate, past areas should have similar characteristics. The percentage of apartments for example, or the street layout. Differences in these variables can have a massive impact on trenching amounts. So, to come up with a single formula is quite difficult.
- Small tweaks to the design architecture or different regulations, can significantly alter the amount of trenching.
Calculating street length
You can also calculate the total street length of an area, from which you can derive the trenching distance. But you will have to guess the impact of street crossings.
For rural areas this might be a good practice, as a lot of trenching happens on one side of the road. But in denser areas, road crossings occur more frequently, as homes are often located on both sides of the road. Crossing a road is expensive and can disturb the community, when roads are blocked for civil works for example.
Let’s look at some numbers to illustrate the impact of street crossings on trenching costs.
In the table below, you can see three different areas. Ohio, a rural area, Jeonju, an urban area, and the suburban area of Sarasota. We calculated the trenching distance of these areas based on the total road length.
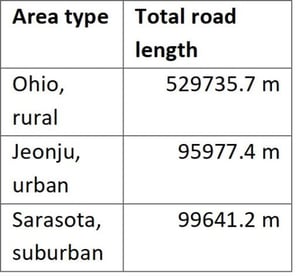
In this table, you can see three different areas. Ohio, a rural area, Jeonju, an urban area, and the suburban area of Sarasota. We calculated the trenching distance of these areas based on the total road length.
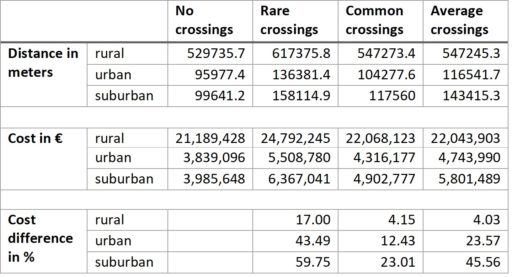
Now, let’s add crossings into the equation. We define three different crossing frequencies. Rare: we avoid crossings as much as possible, taking costs and disruption for the community into account. Common: we don’t take additional factors into account. And average: an in between option.
Below you can see an example of common and rare crossings:

For rural areas we see a cost increase of about 4% to 17% when considering crossings. We would need to look at more rural areas to see if this is consistent. For urban and suburban areas, the impact is even larger. Varying between 12% and 60%.
A new design of the whole area
You can do this by gathering geographic data, or use satellite imagery to draw the trenches. This way of working is interesting for a small area, but too much work for a whole city or state. An in-depth design, using all cables, ducts and equipment gives you more confidence. But is even more time consuming.
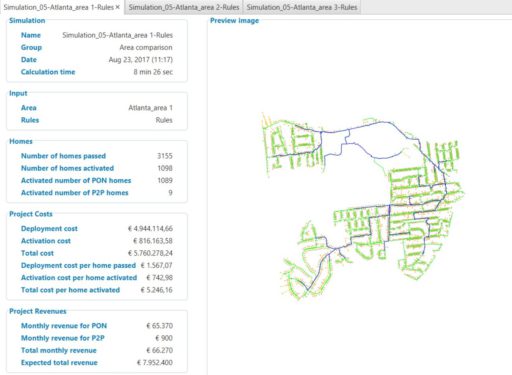
You want to make estimates as fast as possible with maximal accuracy. For this, you might consider using Comsof Fiber simulator. Automated design tools like the Simulator don’t only estimate the trenching distances, they generate the complete bill of materials containing all needed equipment and civil works. They also calculate the network and plan the cables, ducts and equipment. This provides a lot of insights in the network costs.
You can trust tools like the Simulator for greenfield underground FTTH deployments, for brownfields, aerial, 5G fronthaul and backhaul and copper or coax plant upgrades.
You can compare alternative scenarios, which helps you make informed decisions.
In conclusion, there are different ways to estimate your deployment costs. For greenfield underground FTTH networks the amount of trenching is a good cost indicator. However extrapolation and guesswork are risky and probably not worthy of your time.
Instead trust automated design tools which give you all the costs and deployment insights you need.
Comsof Fiber software can help you save money and automate and optimize your designs while working in business districts and congested urban areas. Request a demo today and learn how our software will benefit you.

 Previous